
17 Lead Generation KPIs You Should Be Tracking in 2024
Sep 10, 2024
In this article, we cover 17 essential lead generation KPIs to help you monitor the performance of your lead generation strategies. Read on to learn more.

What is Lead Generation KPI?
Lead generation KPIs (Key Performance Indicators) are metrics used to evaluate the effectiveness of your marketing and sales efforts in attracting and converting potential customers. By tracking these KPIs, businesses can make data-driven decisions, improve lead quality, and optimize their strategies to drive more conversions.
Example: If HubSpot runs a lead generation campaign for its CRM software, generating 5,000 leads in three months at a cost of $10,000, the cost per lead would be $2. If 500 of those leads convert to paying customers, the conversion rate would be (500/5,000) x 100 = 10%.
17 Lead Generation KPIs
Below are some of the most common key performance indicators for generating leads that you need to measure to determine the effectiveness of your lead generation efforts:
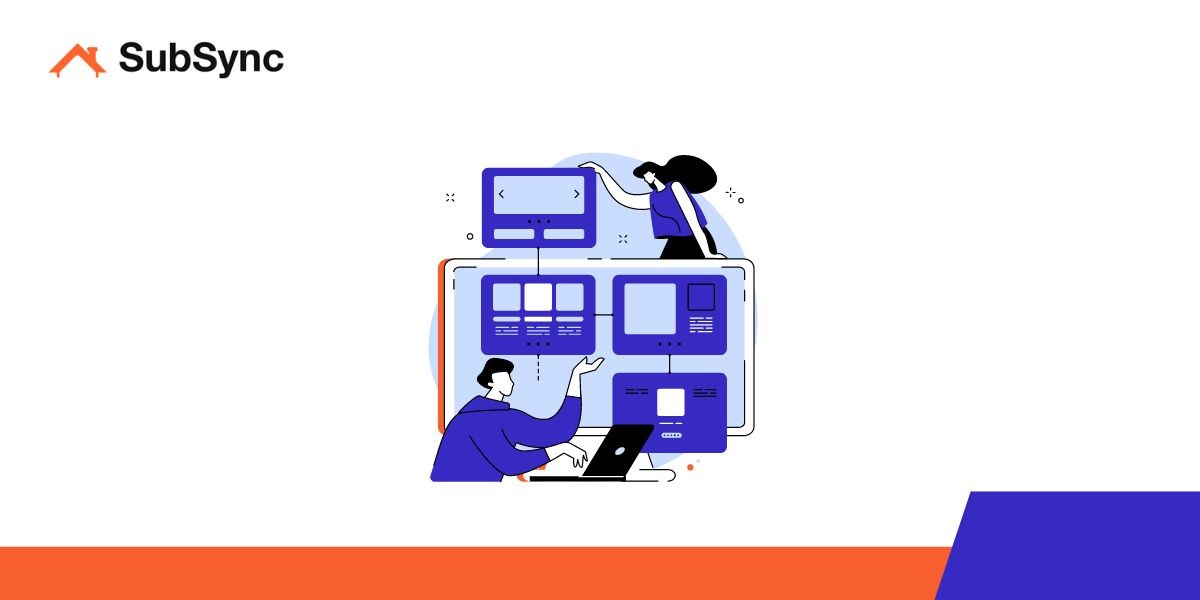
1. Bounce Rate
Bounce rate measures the percentage of visitors who leave your website after viewing only one page. It is often used to assess the effectiveness of landing pages or content relevance in B2B lead generation.
Formula:
Bounce Rate = (Single Page Sessions / Total Sessions) x 100
Example: If your landing page for "Product X" had 2,500 total visitors and 1,000 of them left without visiting other pages, the bounce rate would be (1,000 / 2,500) x 100 = 40%.
2. Website Traffic
Website traffic measures the total number of visitors to your website. It is a key metric for understanding how visible your business is and how successful your lead generation efforts are at driving potential customers to your site.
Formula:
Website Traffic = Total number of visitors over a specific period
Example: If your Google Ads campaign generated 15,000 visitors in one month for "Product Y," you would track that as 15,000 visits for the campaign.
3. Engagement Rate
Engagement rate measures how users interact with your content, especially on social media platforms. High engagement rates typically indicate that your content resonates well with your target audience.
Formula:
Engagement Rate = (Total Engagements / Total Impressions) x 100
Example: If your LinkedIn post for "Product Z" received 500 likes and 100 shares from 10,000 impressions, the engagement rate would be (600 / 10,000) x 100 = 6%.
4. Conversion Rate
Conversion rate measures the percentage of website visitors who take a desired action, such as filling out a form or subscribing to a newsletter. It is critical for determining the success of lead generation landing pages.
Formula:
Conversion Rate = (Number of Conversions / Total Visitors) x 100
Example: If 300 visitors out of 5,000 signed up for a demo of "Service A," the conversion rate would be (300 / 5,000) x 100 = 6%.
5. Number of Leads Generated
This KPI tracks the total number of leads generated from your marketing efforts. It helps assess whether your campaigns are attracting the right quantity of potential customers.
Formula:
Number of Leads Generated = Total leads collected over a specific period
Example: Your campaign for "Product B" generated 1,200 leads in Q2 of 2024.
6. Lead Conversion Rate (LCR)
Lead conversion rate tracks the percentage of leads that turn into paying customers. It is a vital metric for determining the overall effectiveness of both marketing and sales processes.
Formula:
Lead Conversion Rate = (Number of Customers / Number of Leads) x 100
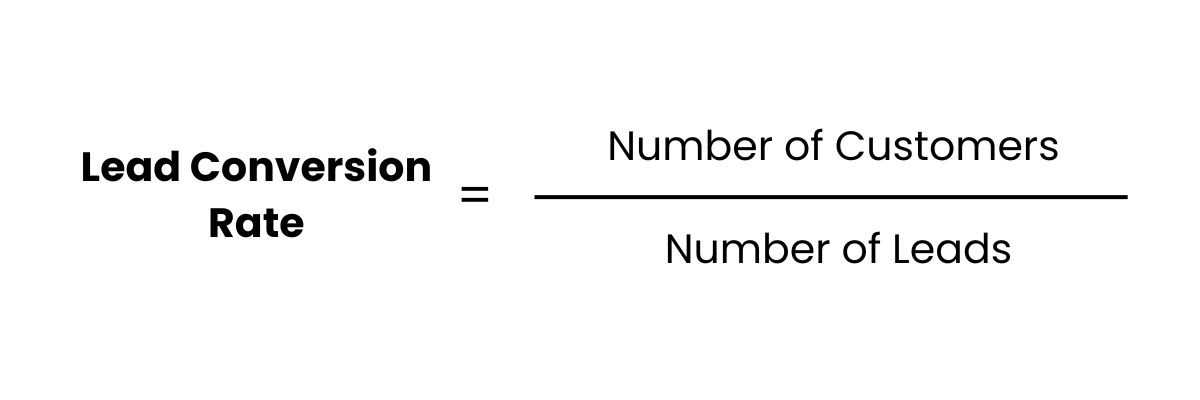
Example: If 80 out of 400 leads converted into paying customers for "Software C," the lead conversion rate would be (80 / 400) x 100 = 20%.
7. Cost Per Lead (CPL)
Cost per lead (CPL) measures the amount spent on acquiring each new lead. This metric helps you assess the cost-effectiveness of your lead generation efforts.
Formula:
CPL = Total Marketing Spend / Total Number of Leads
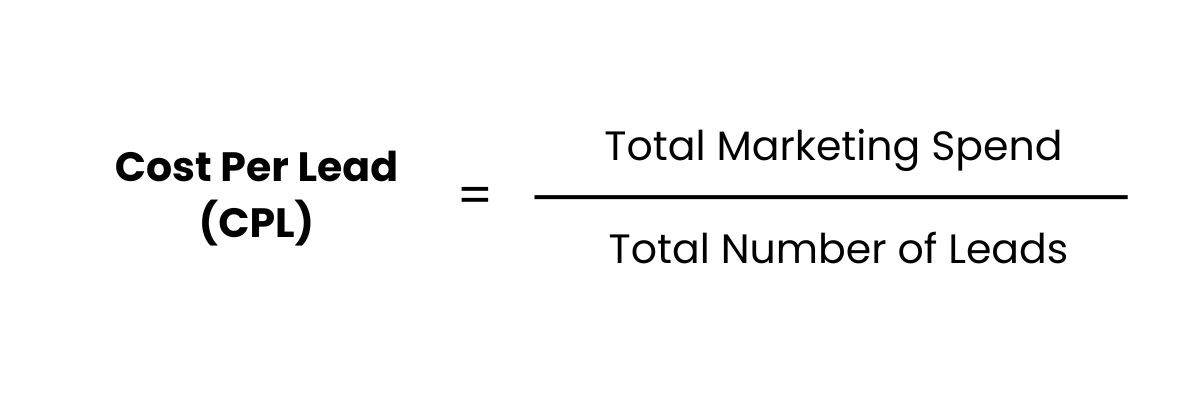
Example: If you spent $12,000 on a LinkedIn ad campaign and generated 600 leads for "Product D," the CPL would be $12,000 / 600 = $20 per lead.
8. Customer Acquisition Cost (CAC)
CAC measures how much it costs to acquire a new customer, factoring in both marketing and sales costs. It is an essential metric for evaluating the efficiency of your lead generation process.
Formula:
CAC = (Total Marketing + Sales Costs) / Number of New Customers
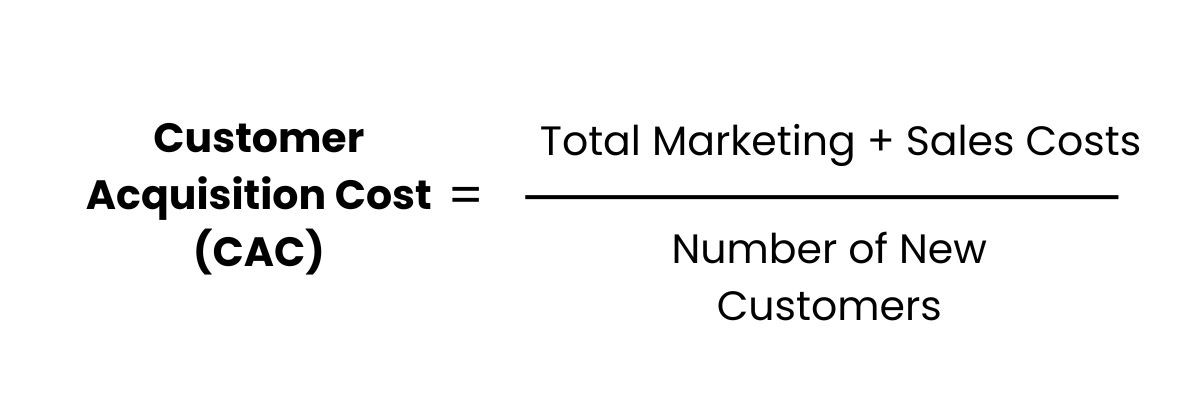
Example: If you spent $50,000 on marketing and sales activities and gained 250 new customers for "Service B," your CAC would be $50,000 / 250 = $200.
9. Customer Lifetime Value (CLV)
CLV estimates the total revenue a customer will generate for your business over the duration of their relationship. This KPI helps you evaluate the long-term value of your leads.
Formula:
CLV = (Average Purchase Value x Purchase Frequency x Customer Lifespan)
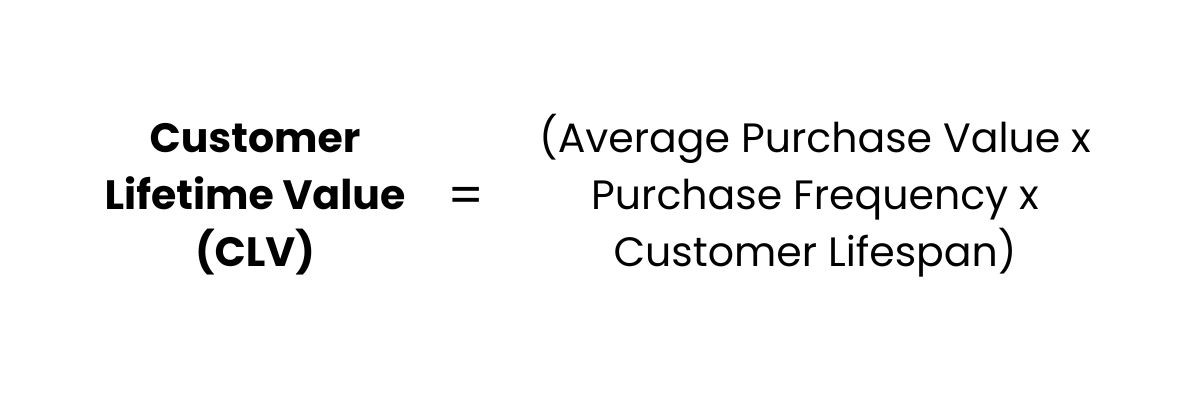
Example: For "Software X," if a customer spends $1,000 per year and remains a customer for 5 years, the CLV would be $1,000 x 5 = $5,000.
10. Attribution Channels
Attribution channels help you identify which marketing channels or touchpoints are most effective in driving leads. This data informs your budget allocation and strategy optimization.
Formula:
There is no direct formula, but attribution tools analyze multi-touch points along the buyer's journey.
Example: Attribution data shows that 40% of leads for "Product Y" originated from paid search, 30% from organic search, and 30% from social media.
11. Average Lead Value
This KPI measures the average revenue generated per lead, helping forecast revenue potential from lead generation activities.
Formula:
Average Lead Value = Total Sales Value / Total Number of Leads
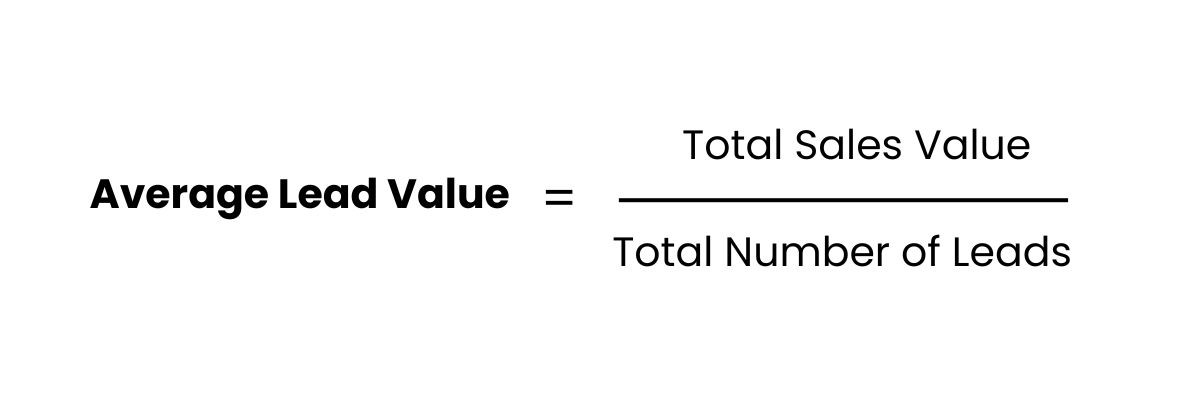
Example: If you generated $150,000 from 300 leads for "Product C," the average lead value would be $150,000 / 300 = $500.
12. Sales Qualified Opportunities (SQOs)
Sales qualified opportunities are leads that have progressed through your funnel and are likely to convert. This KPI helps you track the quality of your leads.
Formula:
There is no fixed formula, but SQOs are tracked through CRM systems.
Example: Your sales team identified 120 SQOs out of 600 leads generated from a campaign for "Service D."
13. Meetings Booked and Attended
This KPI measures the number of meetings booked with potential leads and those that were attended. It is an indicator of lead engagement and the effectiveness of your sales team.
Formula:
Meetings Booked and Attended = Total Meetings Scheduled vs. Attended
Example: Out of 50 meetings booked with leads for "Product X," 40 were attended, resulting in an 80% attendance rate.
14. Inbound Response Time
Inbound response time tracks how quickly your team responds to incoming leads. A faster response time often leads to better conversion rates.
Formula:
Inbound Response Time = Total Time to Respond / Number of Inbound Leads
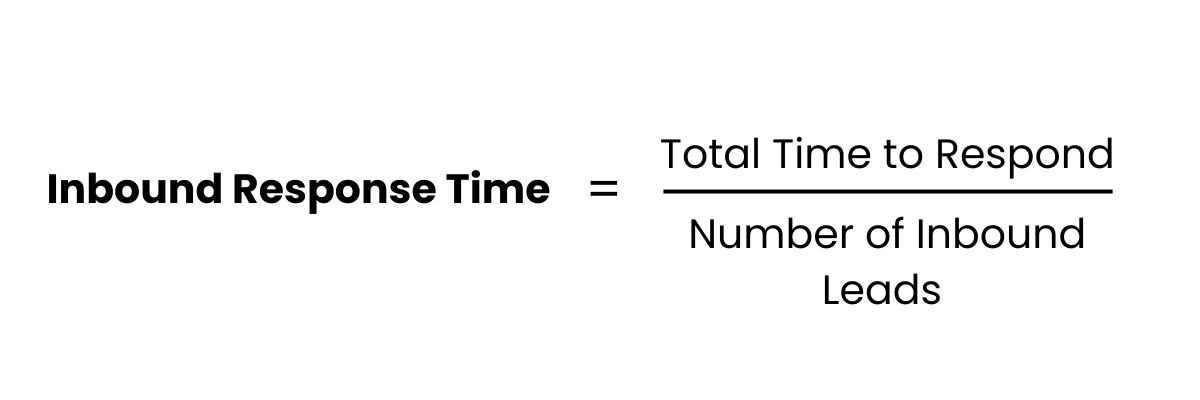
Example: Your team’s average response time for "Product Y" leads was 3 hours, improving conversion rates by 15%.
15. Cost Per Customer Acquisition (CPA)
CPA measures how much it costs to acquire each customer. This is critical for evaluating the overall efficiency of your lead generation efforts.
Formula:
CPA = Total Spend on Acquisition / Total New Customers
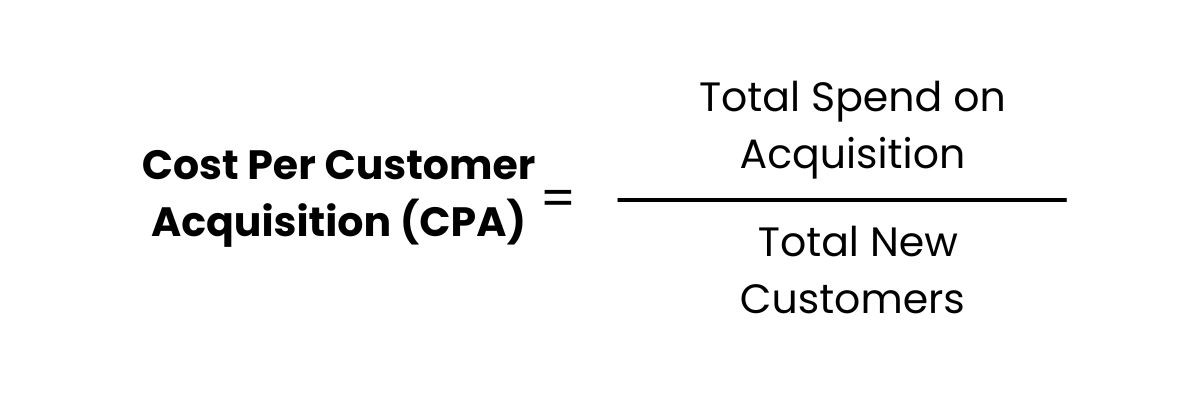
Example: For "Service B," if you spent $25,000 to acquire 125 new customers, your CPA would be $25,000 / 125 = $200.
16. Email Marketing Performance
Email marketing performance tracks the success of email campaigns using metrics such as open rate and click-through rate. These KPIs are key for nurturing and converting leads.
Formula:
Click-Through Rate (CTR) = (Clicks / Emails Sent) x 100
Example: An email campaign for "Product D" sent to 5,000 recipients generated 250 clicks, giving a CTR of (250 / 5,000) x 100 = 5%.
17. Return on Ad Spend (ROAS)
ROAS measures the revenue generated for every dollar spent on advertising. It is essential for evaluating the profitability of paid ad campaigns.
Formula:
ROAS = Revenue from Ads / Cost of Ads
Example: If you spent $10,000 on Google Ads for "Product X" and generated $40,000 in revenue, your ROAS would be $40,000 / $10,000 = 4x.
We hope that you now have a better understanding of KPI lead generation and how to track them for optimizing your sales funnel.
If you enjoyed this article, you might also like our articles on metrics for lead generation.